The forecasting problem in Salesforce
Salesforce has a built-in forecasting feature. It is basic, rigid, and most revenue teams outgrow it within a quarter. The alternative is a standalone tool like Clari, Gong Forecast, or BoostUp. Each one costs $50-80+ per user per month, requires a separate login, and pulls your pipeline data into yet another system.
For a team of 20 reps and 5 managers, that is $15,000-25,000+ per year for pipeline visibility alone. It does not help with backups, deployments, GDPR compliance, or org health. You end up paying for two platforms that should be one.
Pocavi is a Salesforce operations platform first: metadata backups, smart deployments, GDPR compliance, org health scanning. We built a full forecasting module as an add-on because the data is already there and the teams that need ops tooling are the same teams that need pipeline visibility. Same login. Same org connections. One bill.
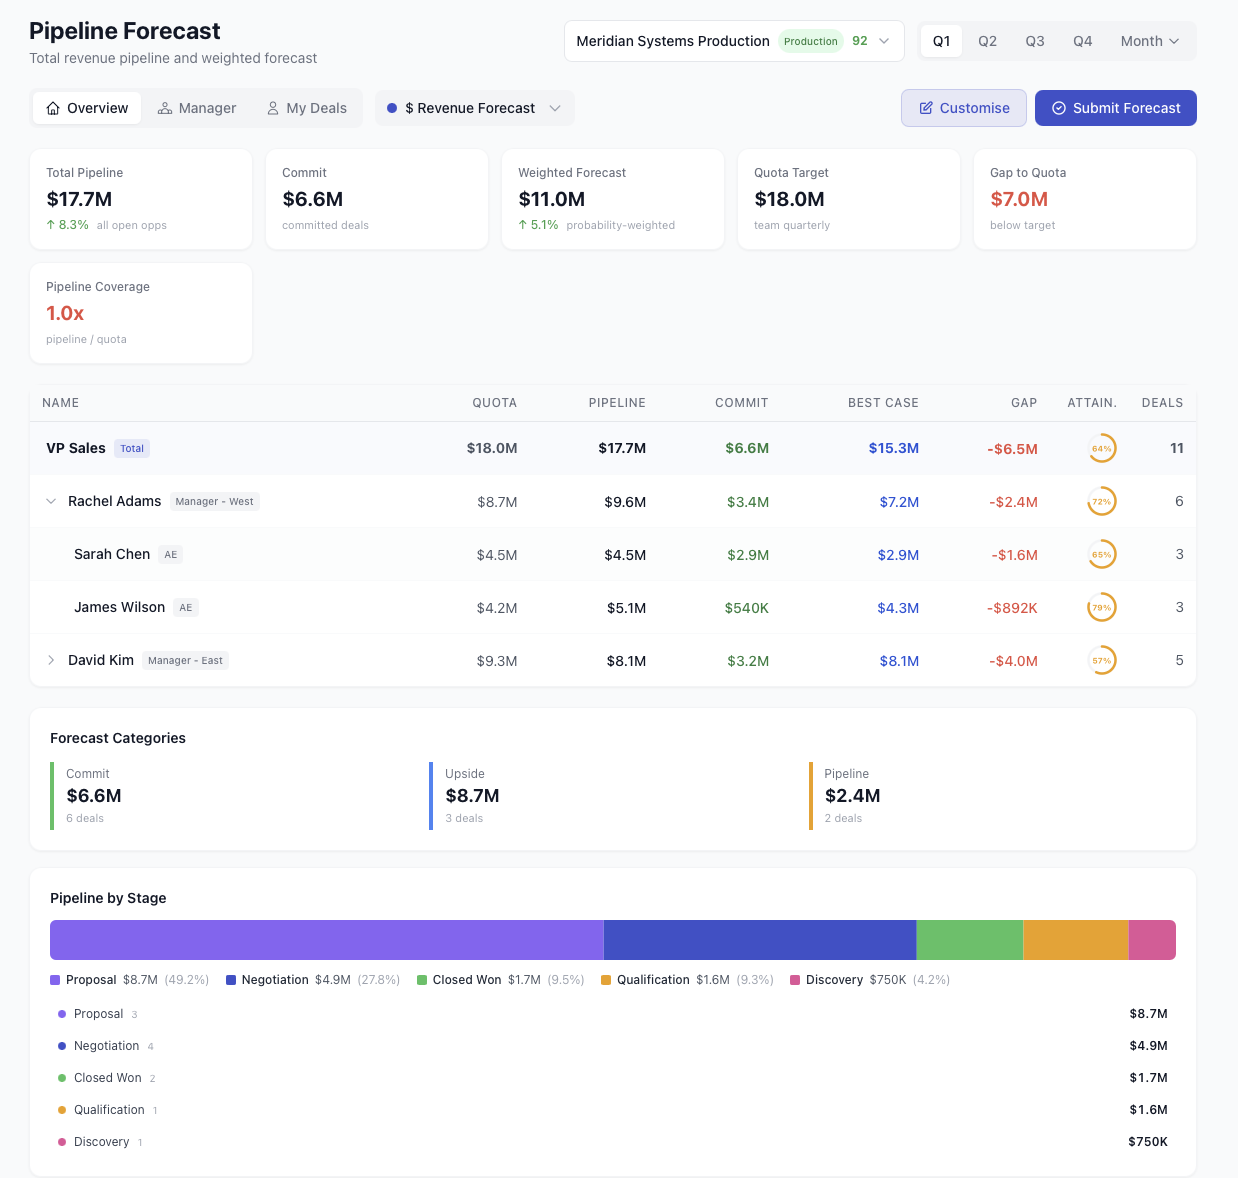
Pipeline at a glance
The pipeline overview gives you the full picture on one screen. Summary cards show total pipeline, weighted forecast, integrated forecast, best case, and quota. Below that, a team hierarchy table breaks down every rep's numbers with colour-coded attainment gauges. At the bottom, forecast categories and a stage bar show where your pipeline actually sits.
Four role-based views (CRO, VP, Manager, Rep) mean everyone sees the right level of detail. A CRO gets the company roll-up with region drill-down. A rep sees their own deals and quota progress. Click any row to expand the hierarchy and inspect individual numbers.
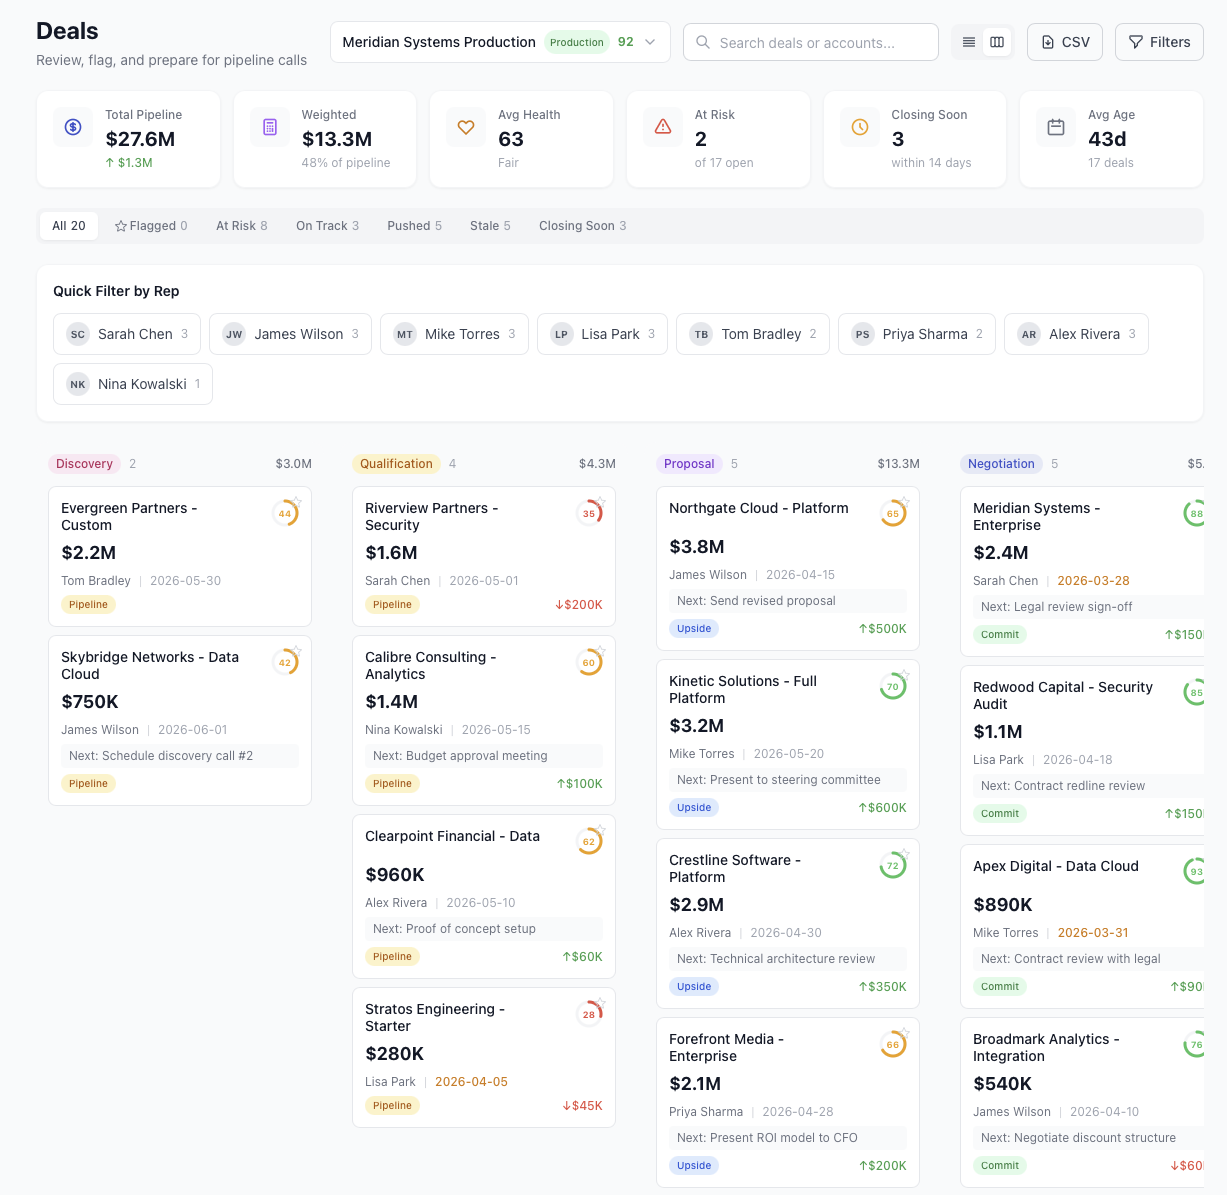
Deals: two views, one drawer
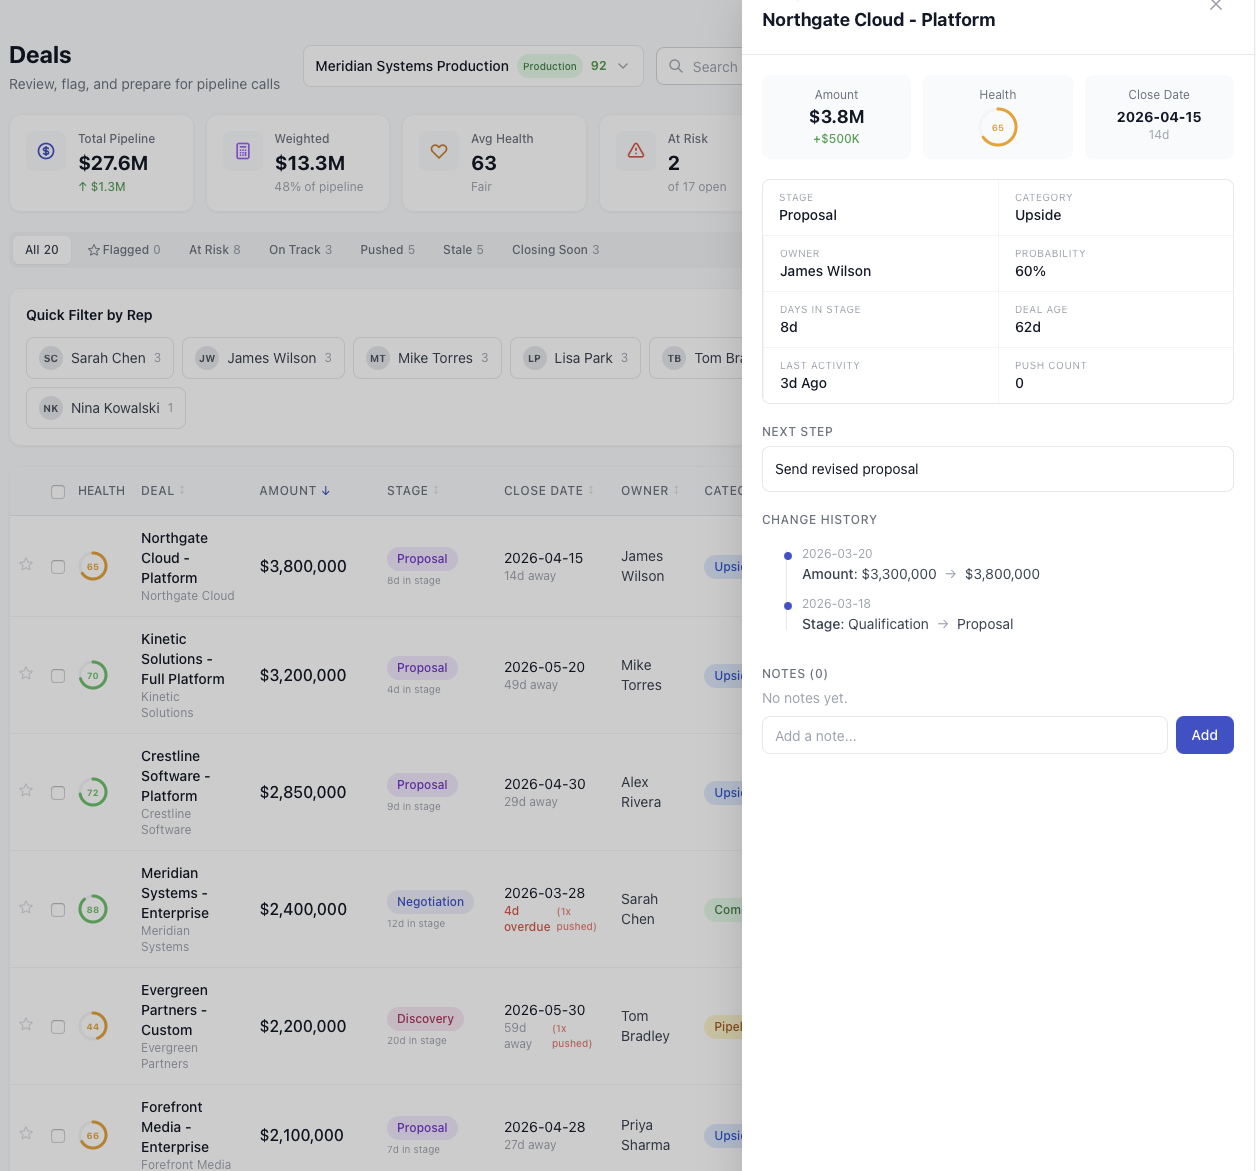
The deals page has two views. Table view shows every deal in a sortable, filterable grid with health scores, risk badges, and quick filter chips for rep, stage, category, and risk level. Kanban view arranges deals as cards by stage, with amounts summed per column and next steps visible on each card.
Click any deal in either view to open the inspector drawer. It shows the AI health score (0-100), amount, close date, stage, probability, next step, and full change history. Managers can add notes directly in the drawer to flag deals or prep for pipeline calls. Everything in one place, no tab switching.
What-if scenarios
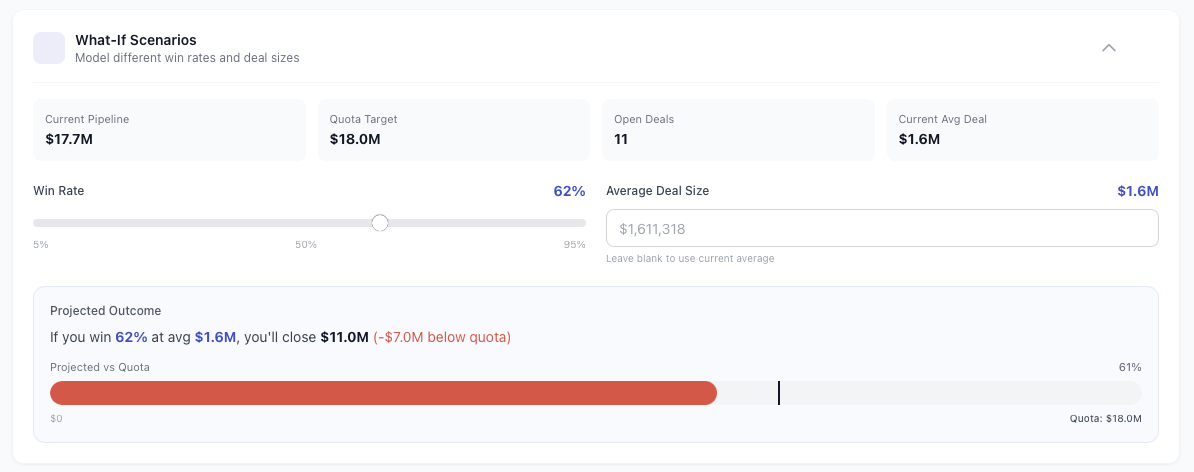
Before a forecast call, you want to know: what happens if win rates drop? What if average deal size changes? The what-if panel lets you drag a win rate slider and adjust average deal size, then instantly see the projected outcome against quota. No spreadsheet needed.
The example below shows $17.7M in pipeline, an $18M quota, 11 open deals, and a current average deal size of $1.6M. At a 62% win rate, the projected close is $11M, which is $7M below quota (61% attainment). Slide the win rate to 75% and the picture changes immediately. This is the tool you open five minutes before the Monday forecast call.
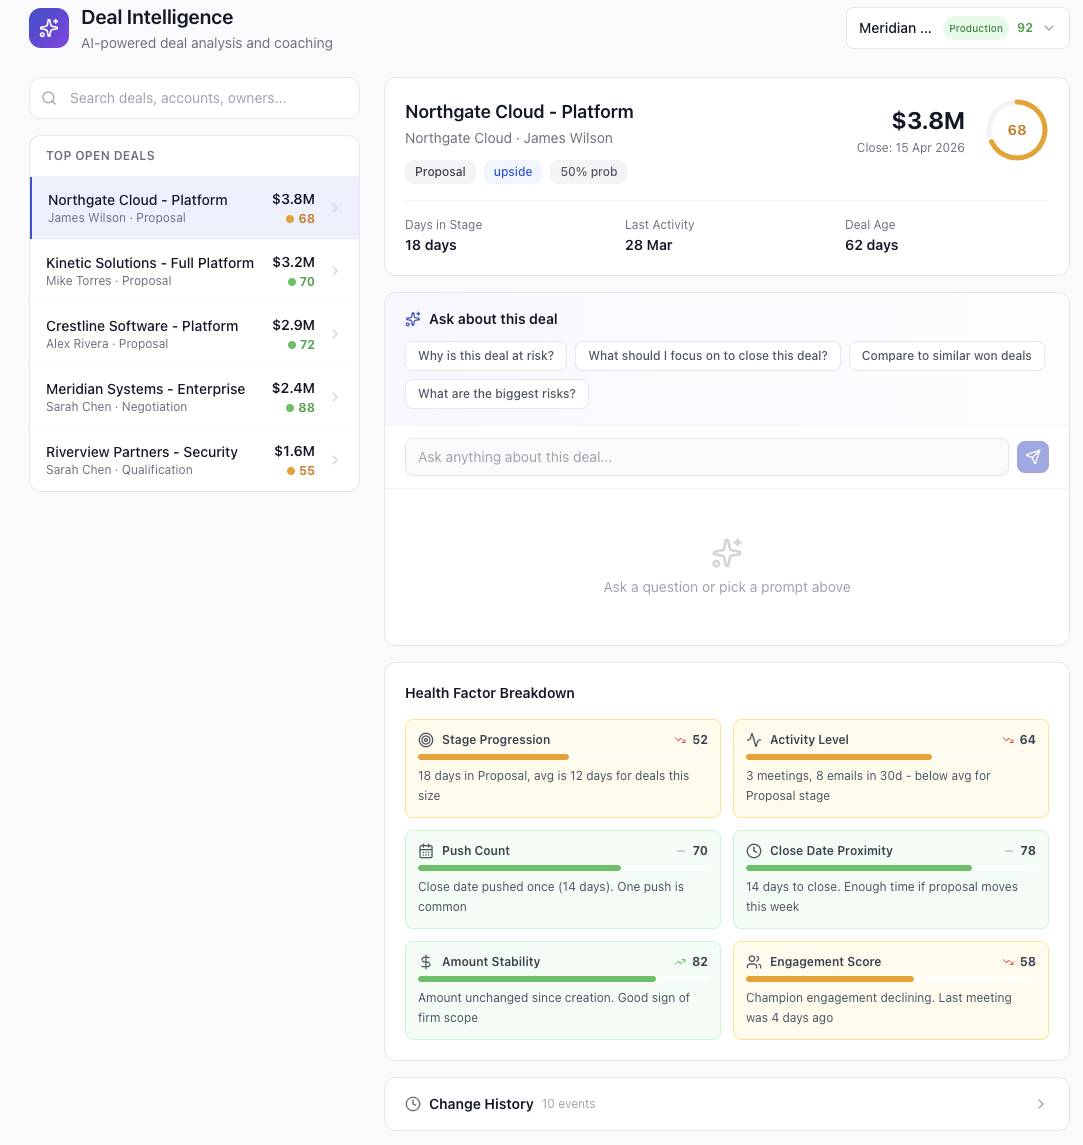
Coaching insights
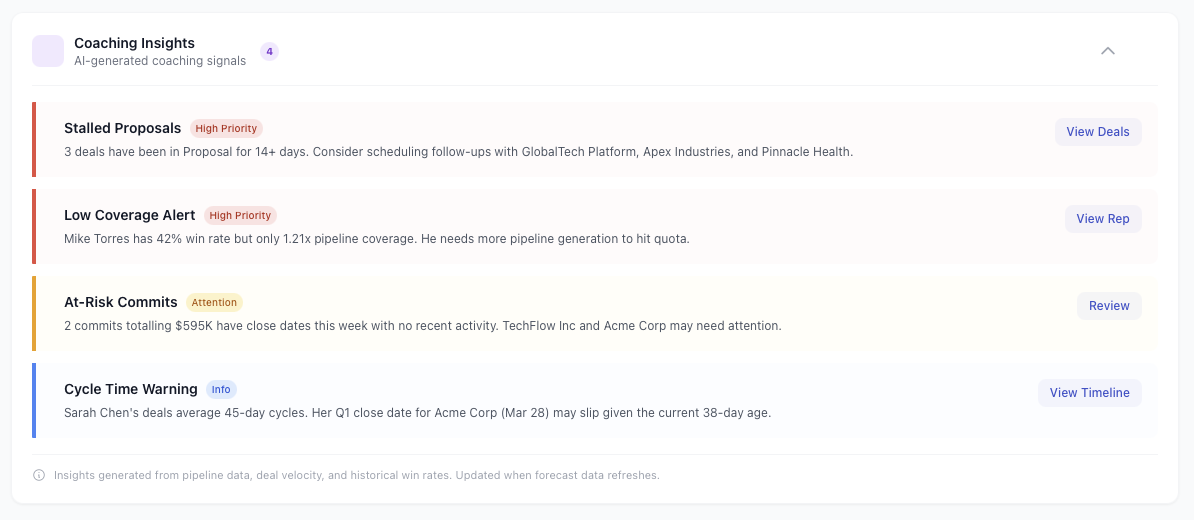
Managers do not have time to review every deal manually. The coaching insights panel surfaces the four things that matter most: stalled proposals that have not moved, low pipeline coverage that puts the quarter at risk, deals with no recent activity, and reps whose cycle times are stretching.
Each insight is colour-coded by urgency (red for critical, amber for warning, blue for informational) and links directly to the relevant deals. Use it to prep for one-on-ones or flag issues in the Monday pipeline review. The insights update with every snapshot, so they always reflect the latest state of your pipeline.
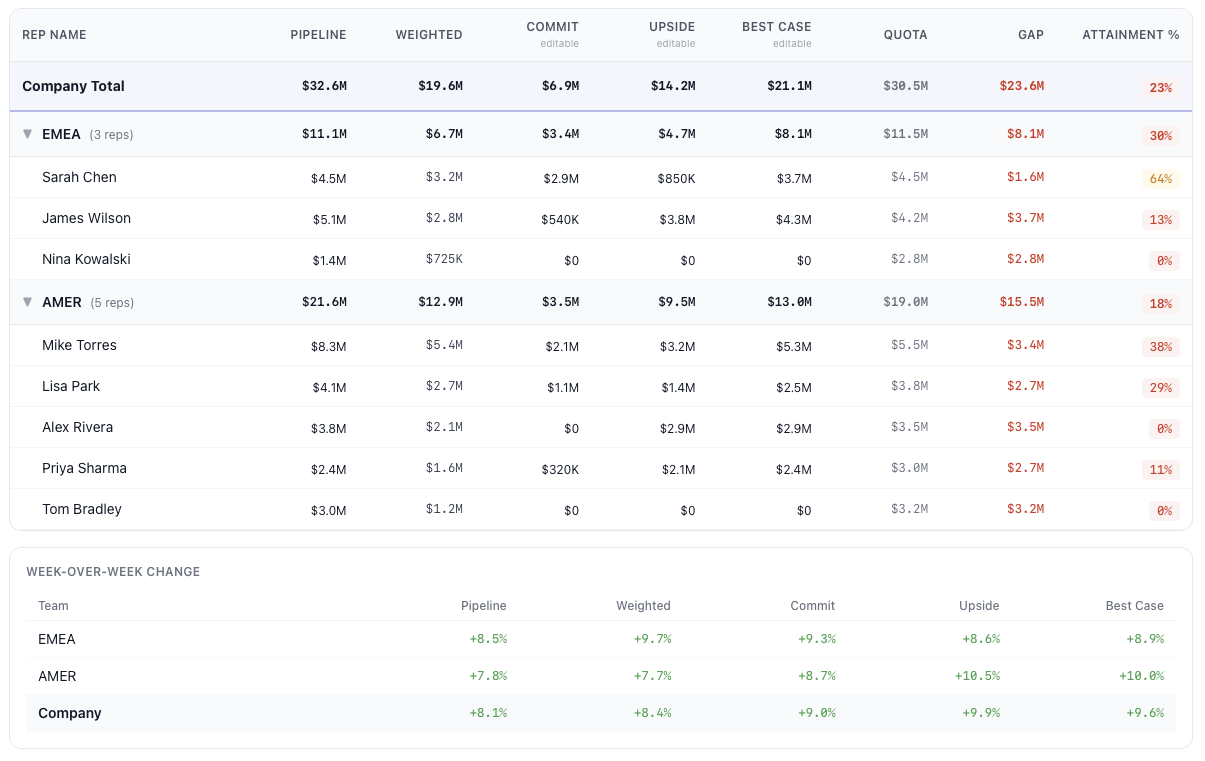
Forecast submissions
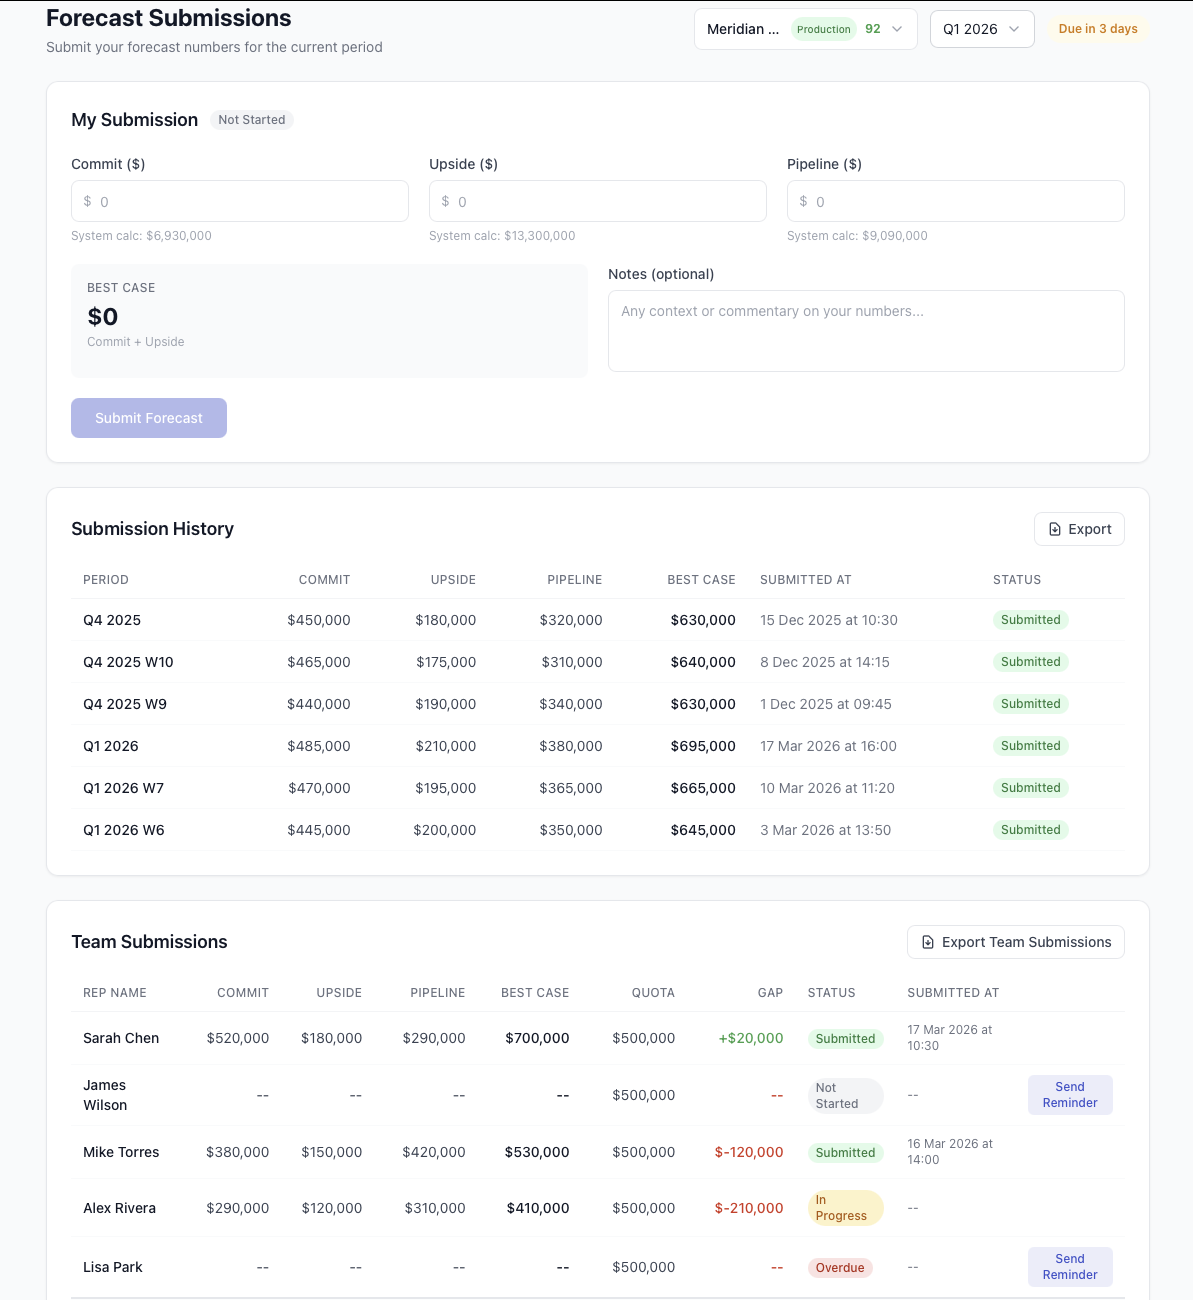
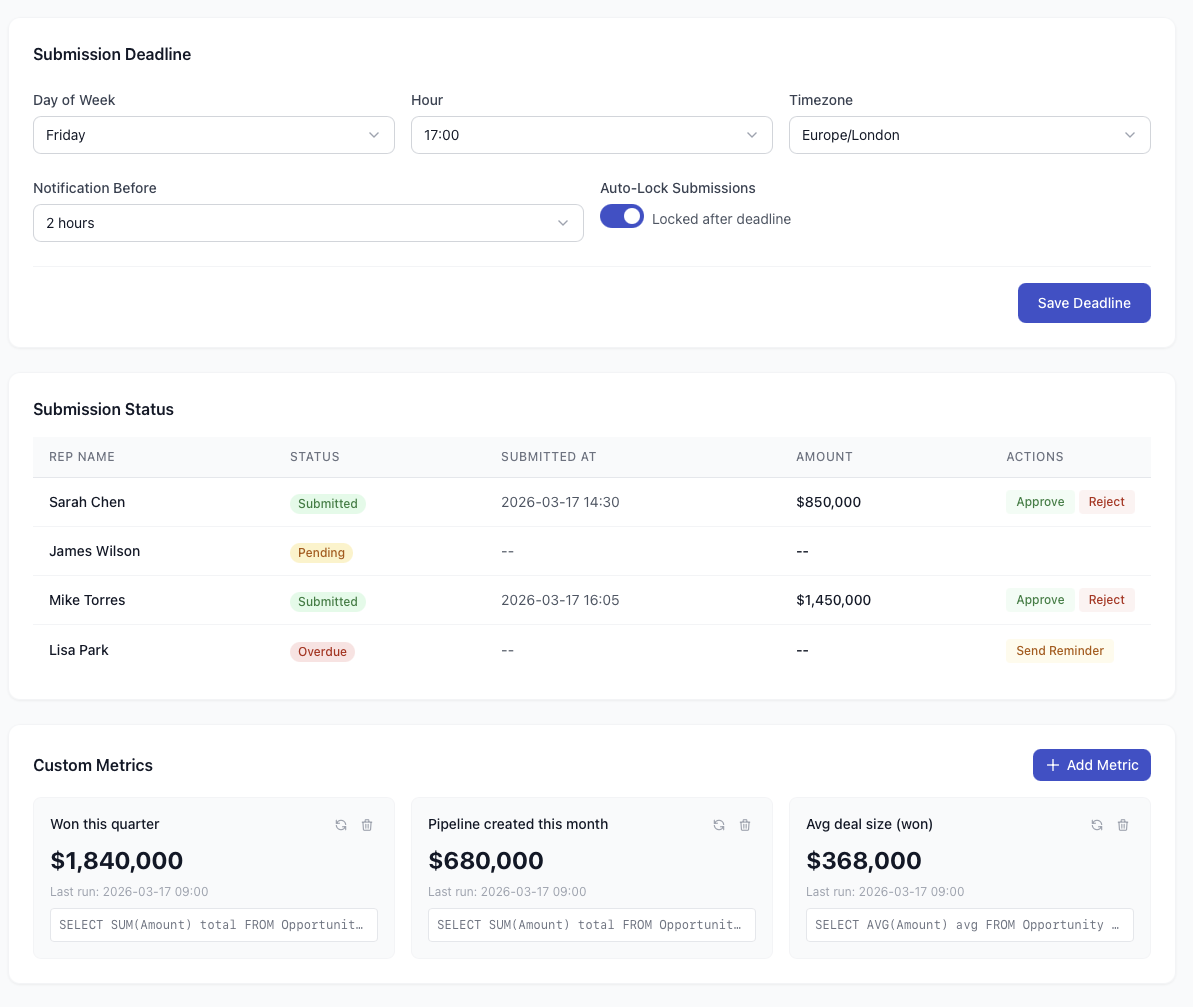
Reps submit their commit and pipeline numbers each period. The submission form shows their current pipeline alongside the input fields, with optional notes for context. Submission history tracks every past submission with the amounts, dates, and variance from the previous submission.
Managers see a team submissions table showing who has submitted, who is pending, and who is overdue. Deadlines are configurable by day, time, and timezone. Turn on auto-lock and submissions close automatically at the deadline. A notification fires beforehand so nobody gets caught out.
Alerts and risk rules
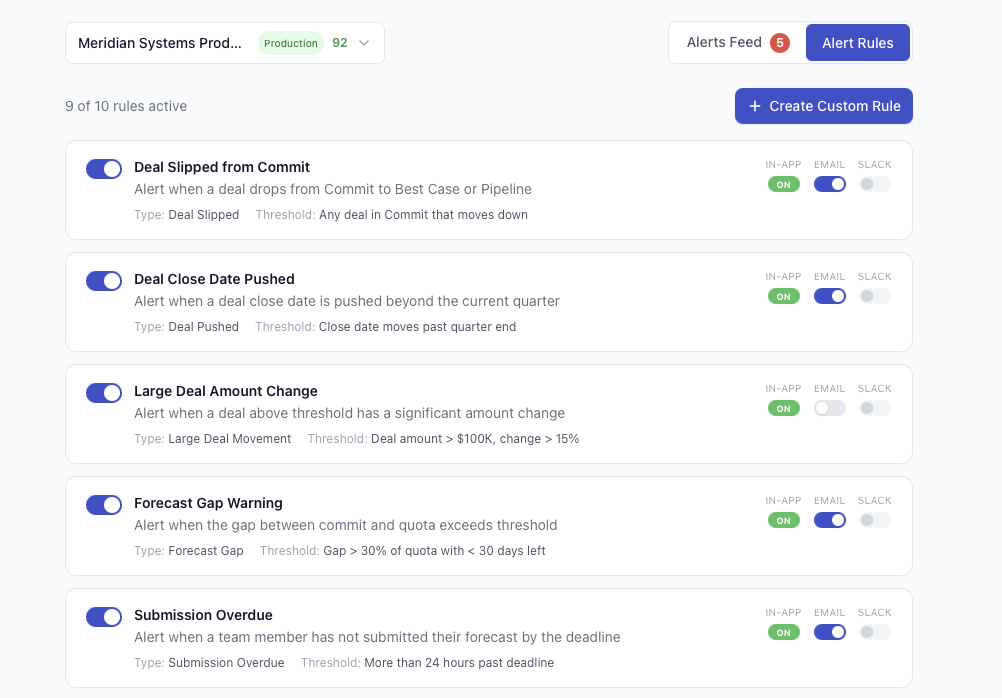
Nine built-in alert rules catch the most common pipeline risks: deal slipped from commit, close date pushed, large amount change, forecast gap widening, submission overdue, and more. Each rule has a toggle so you can enable or disable it. Most teams turn on all nine from day one.
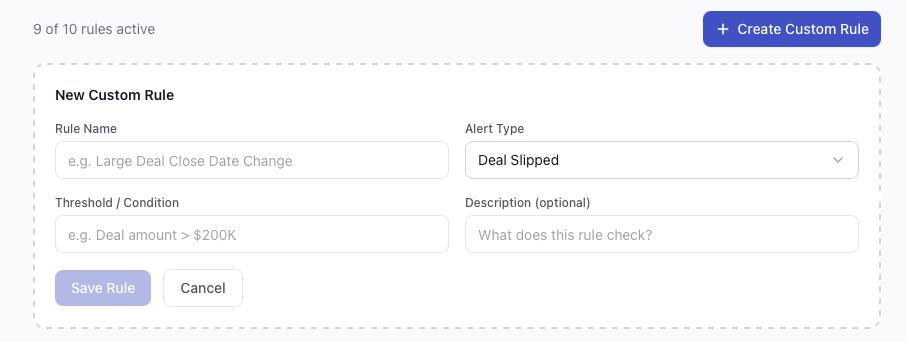
Need something specific to your business? Create custom rules with a name, alert type, threshold condition, and description. The custom rule builder supports any combination of deal field and threshold value, so you can alert on deals over $500K that slip stage, or flag any deal with more than three push-outs.
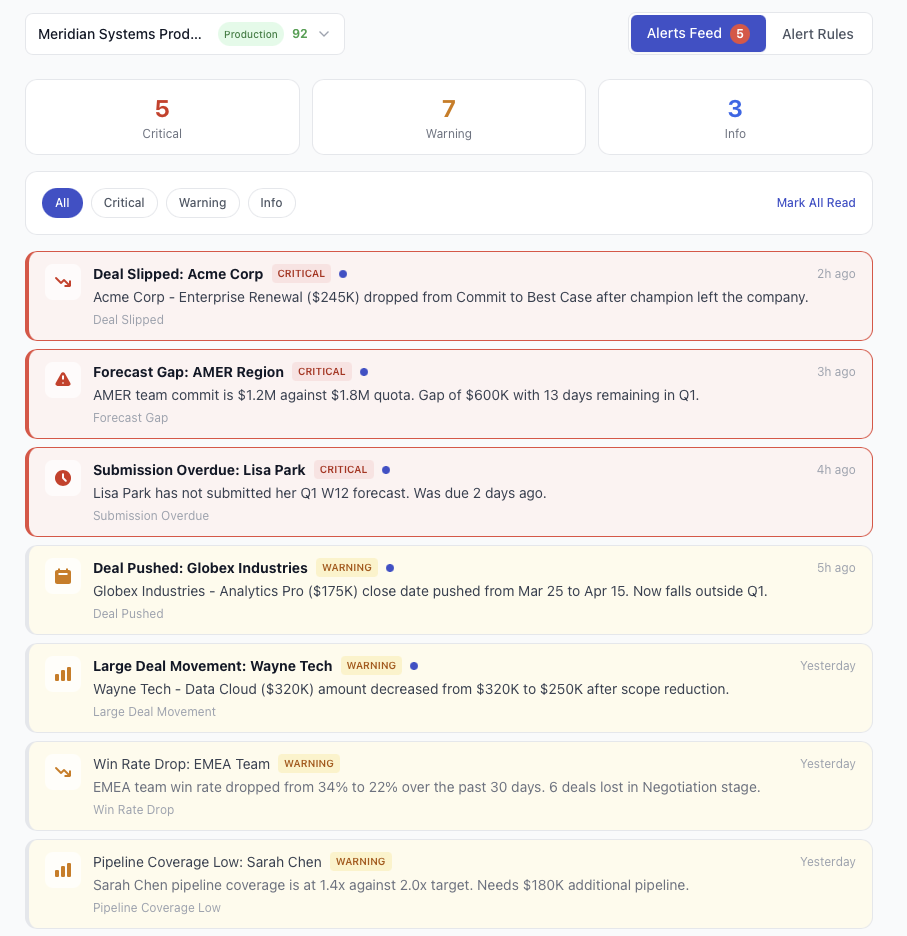
Active alerts appear in a live feed, colour-coded by severity. Critical alerts (red) are things like committed deals slipping to best case or forecast gaps exceeding thresholds. Warnings (amber) flag deals that are drifting. Informational alerts (blue) cover submissions and routine changes. Click any alert to jump straight to the relevant deal or submission.
9 forecast lenses
Most forecasting tools show pipeline by Opportunity Amount. That works for simple sales motions. But if you sell renewals, track ACV separately from bookings, or have multiple revenue streams, you need more flexibility.
Pocavi ships with nine built-in lenses: Revenue Forecast, ARR Forecast, Deal Count, Total Contract Value, Net New, New Business, Weighted Pipeline, and FX Adjusted. Each lens defines what gets measured and how. Switch between them on the pipeline page and every number on the screen recalculates.
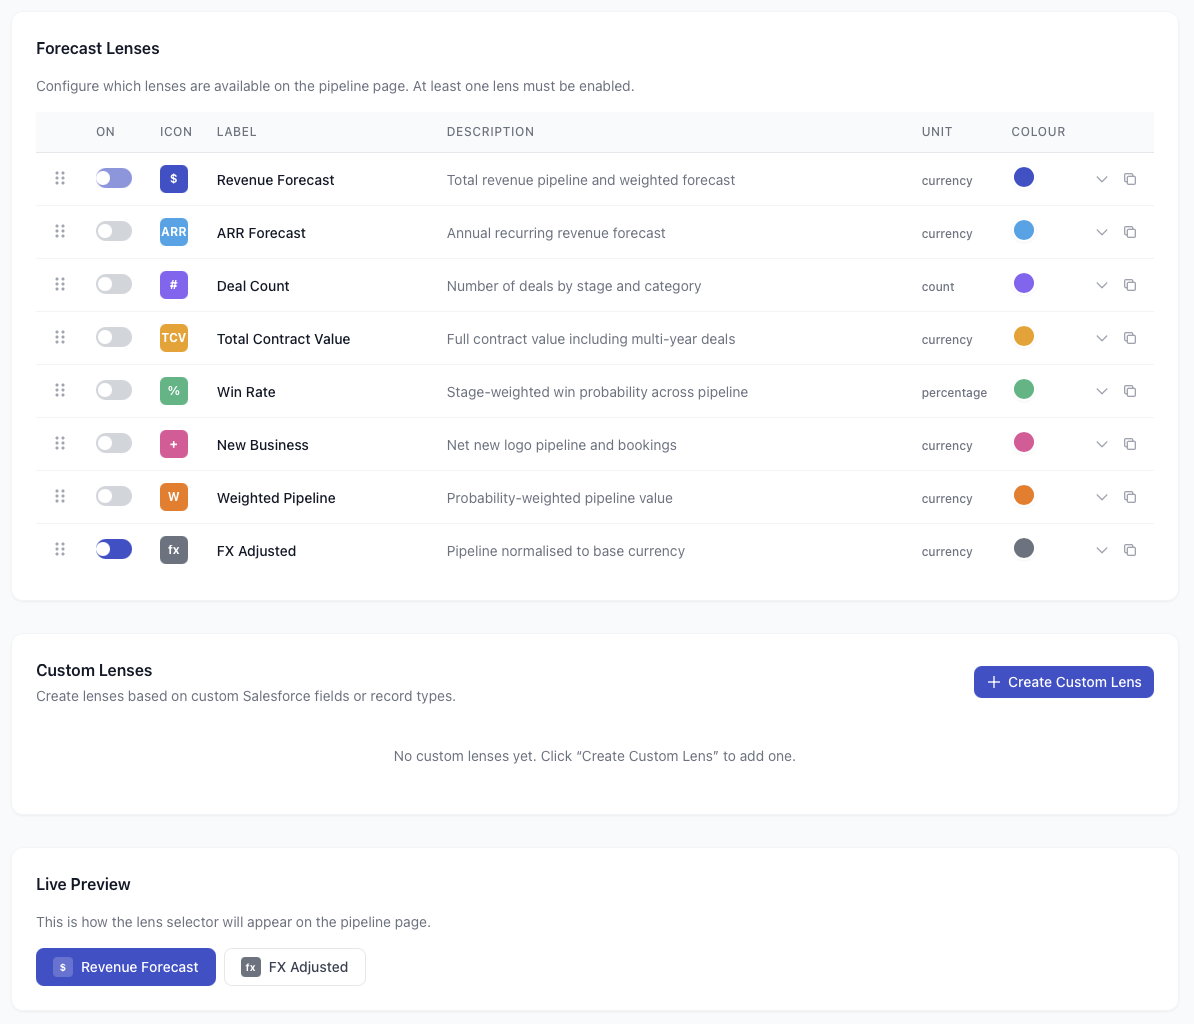
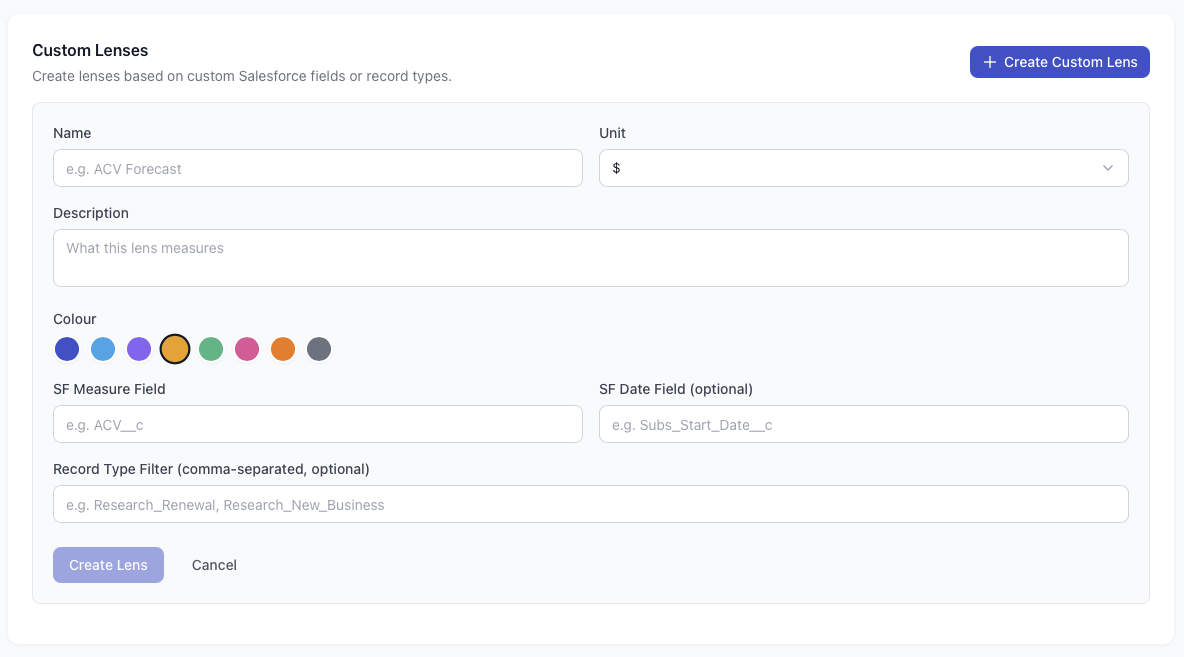
Need a lens for Unfunded Revenue, Net Recurring ACV, or any other currency field on your Opportunity object? Create a custom lens. Map it to a Salesforce field, pick a date field, set an optional record type filter, choose a colour, and it appears alongside the built-in lenses. Every view in the module respects the active lens.
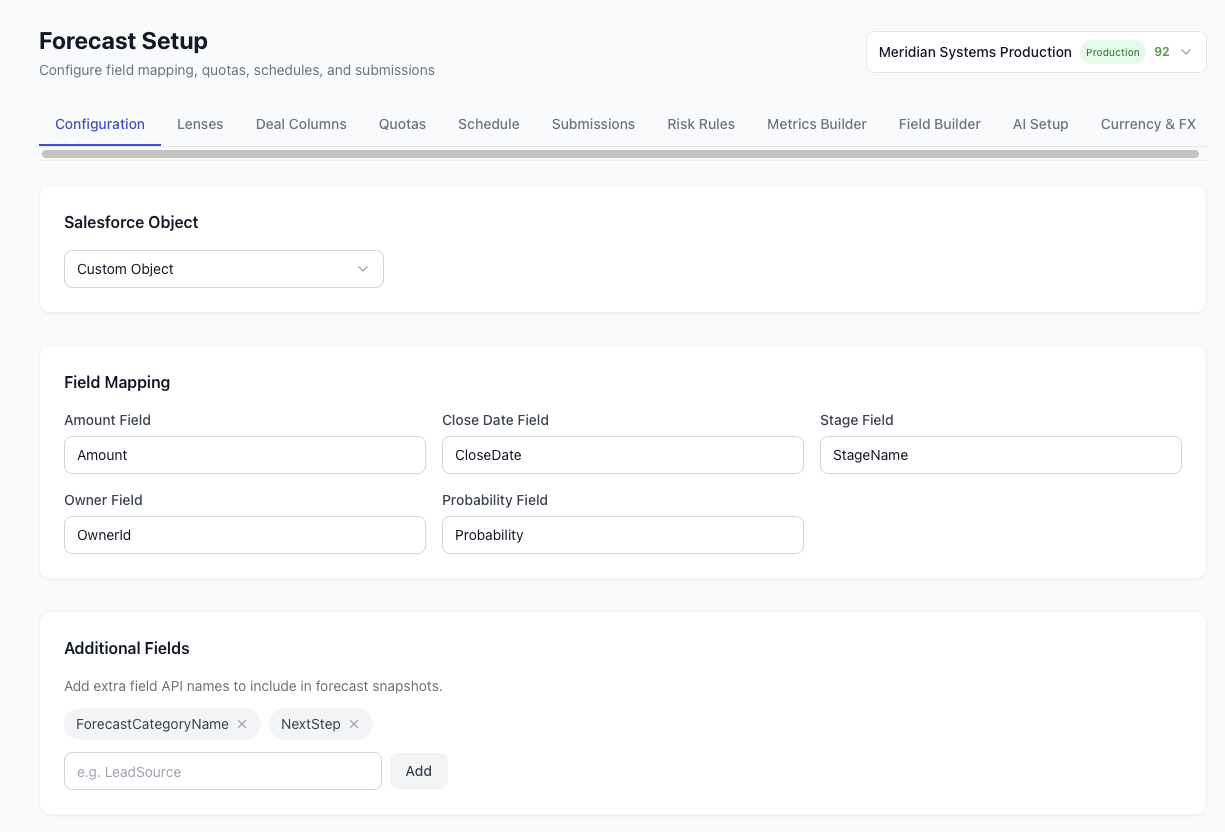
Setup your way
The setup page has six tabs covering every configuration option. Start with field mapping: tell Pocavi which Salesforce fields represent Amount, Close Date, Stage, and Probability. Add extra fields to include in snapshots (custom fields like MEDDIC score or competitor). Pick your Salesforce object if you use a custom opportunity object.
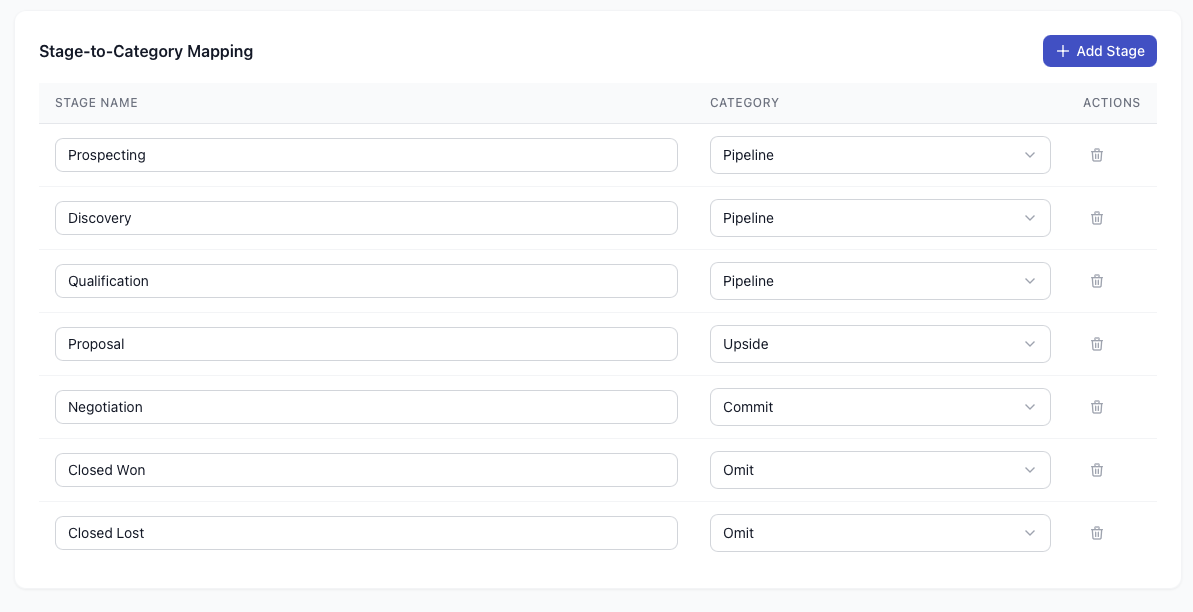
Stage-to-category mapping controls how your pipeline stages translate into forecast categories. Map each stage to Pipeline, Upside, Commit, or Omit. Prospecting and Discovery go to Pipeline. Proposal goes to Upside. Negotiation goes to Commit. Closed Won and Closed Lost go to Omit. Adjust to match your sales process.
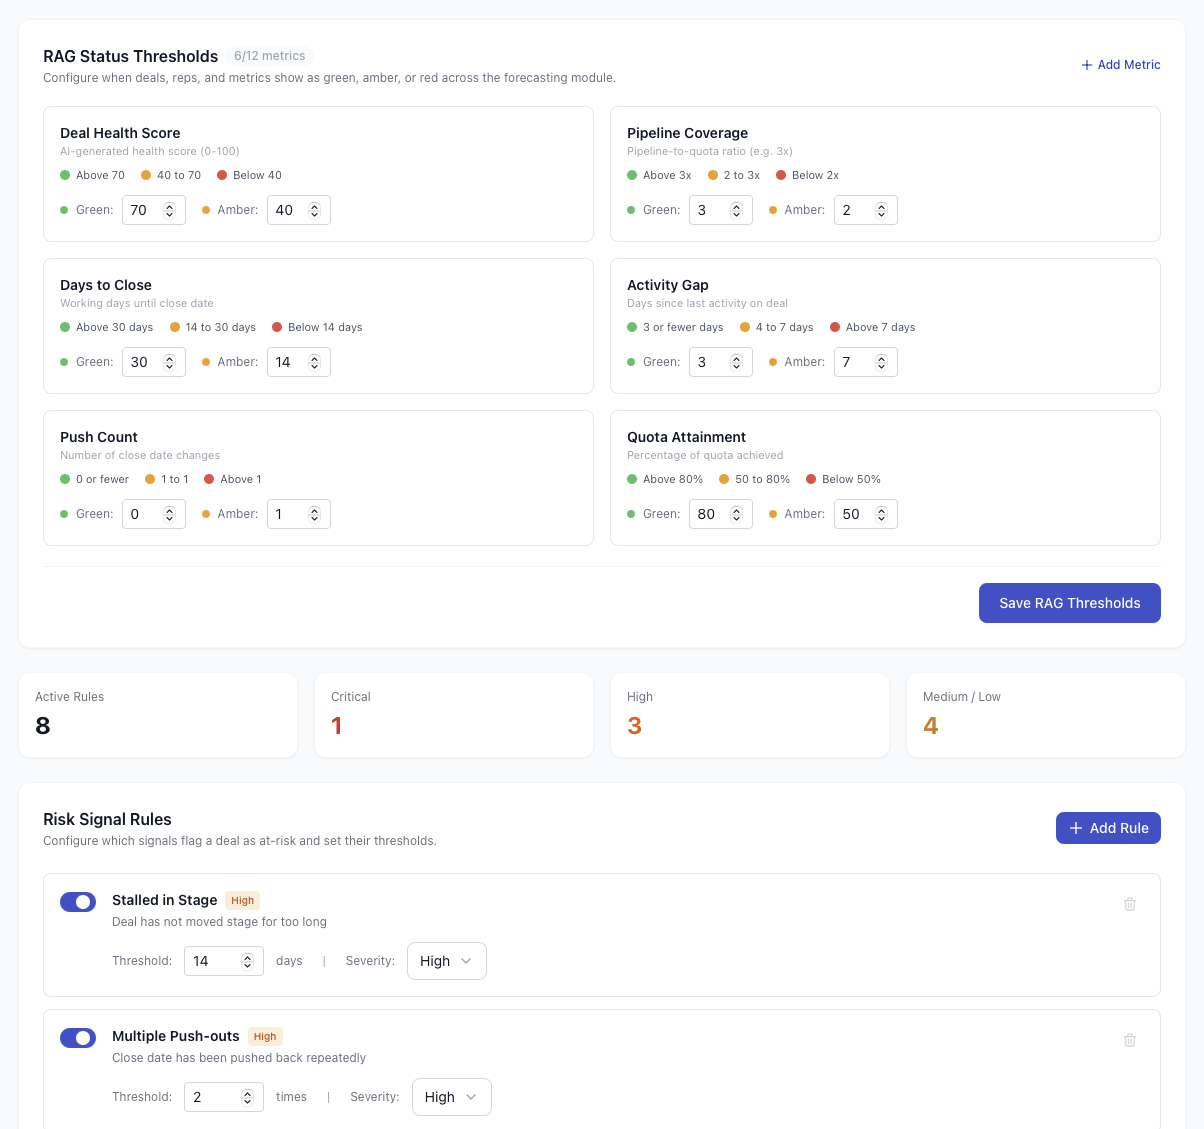
RAG thresholds control the deal health scoring. Configure green, amber, and red boundaries for six metrics: deal health score, pipeline coverage, days to close, activity gap, push count, and quota attainment. Below the thresholds, risk signal rules let you define custom conditions that trigger warnings on specific deals.
SOQL metrics builder
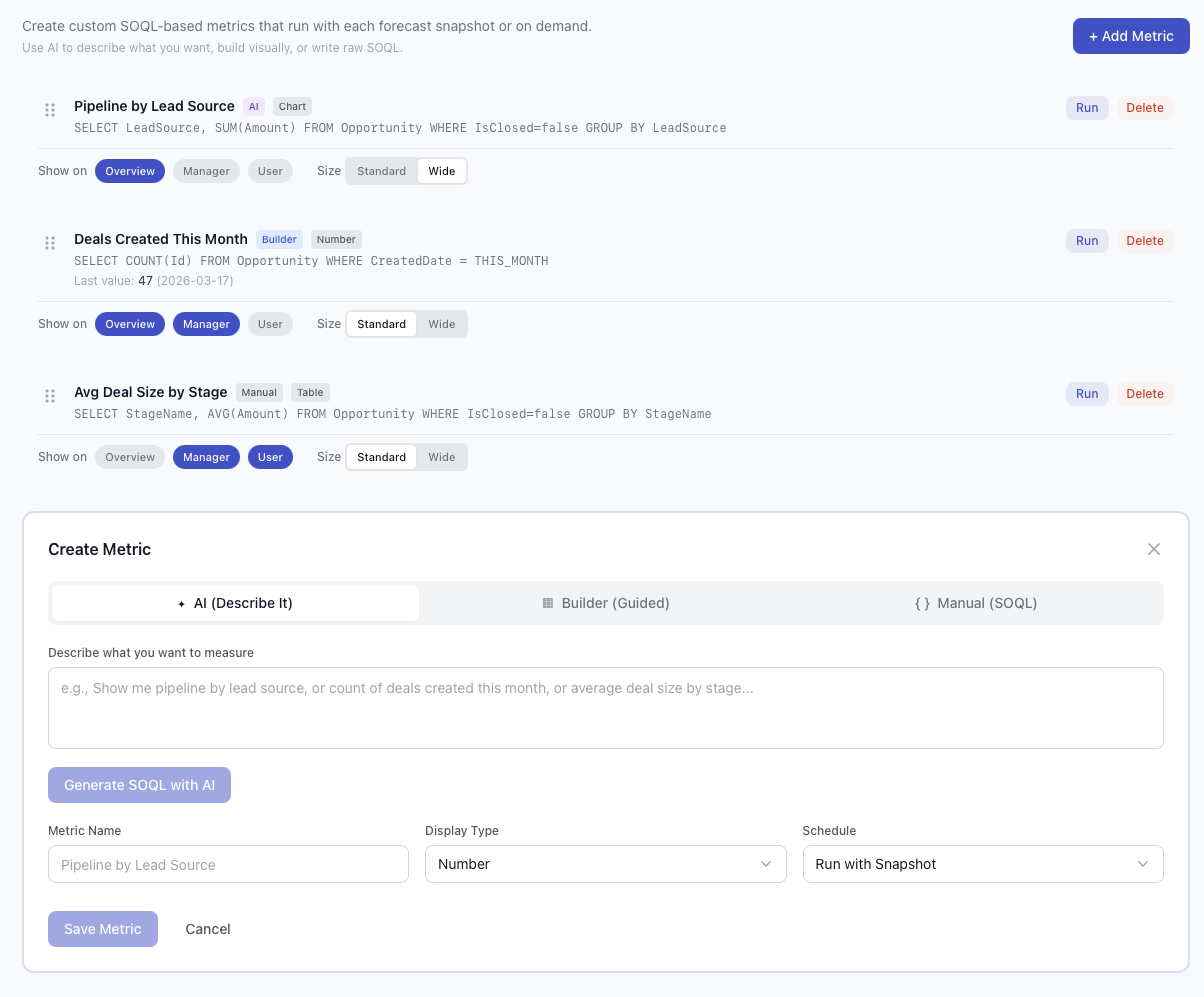
The summary cards on the pipeline page are not static. Build custom metrics from SOQL queries that run against your live Salesforce data. Sum ACV by lead source, count deals created this month, calculate average deal size by stage. The metric builder supports SUM, AVG, and COUNT aggregations.
Two modes: AI-assisted (describe what you want and the query is generated for you) or manual (write the SOQL yourself). Each metric gets a name, display type, and schedule. Run it with each snapshot so the numbers stay current, or trigger it on demand.
Multi-currency support
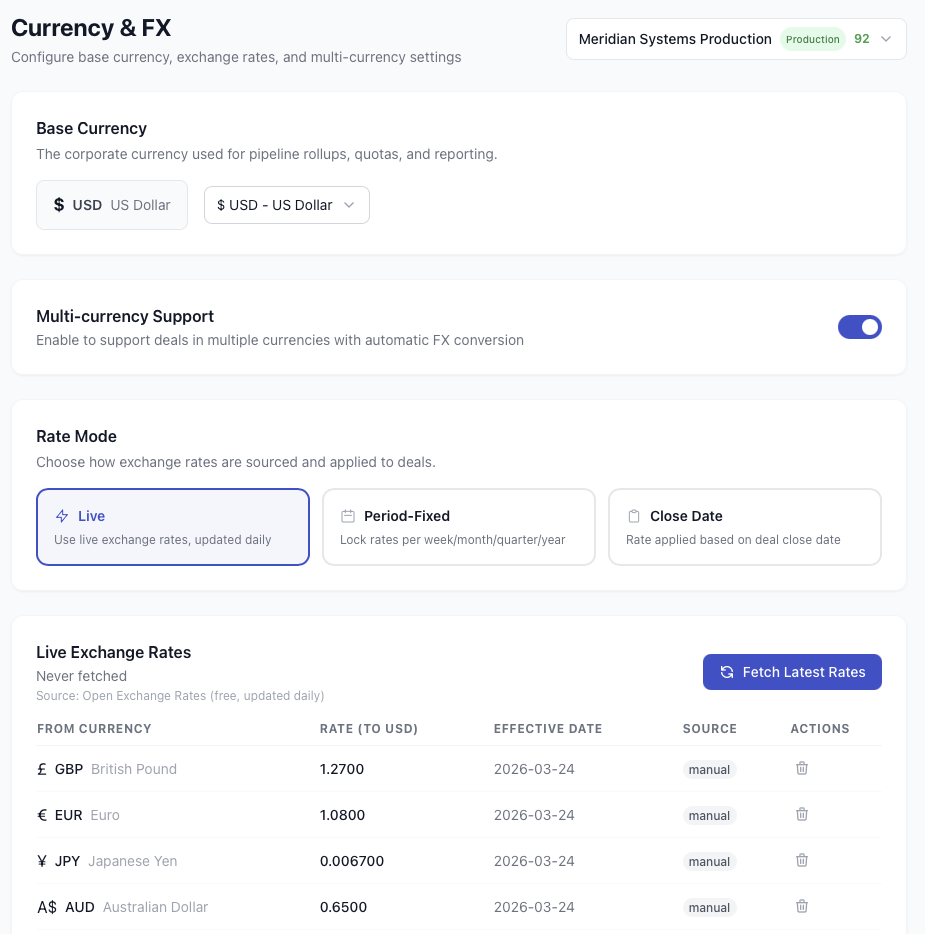
If your team sells in multiple currencies, Pocavi handles the conversion automatically. Set your base currency (USD, GBP, EUR, or any ISO code), toggle multi-currency support on, and choose between live rates (updated weekly from exchange rate APIs) or fixed rates (locked at a specific point in time for quarterly reporting).
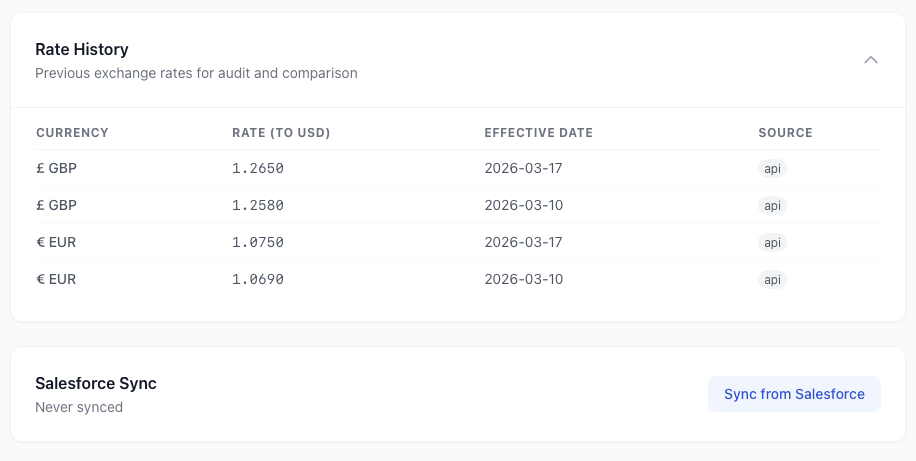
Rate history shows every exchange rate used, with effective dates and source. If your Salesforce org already has multi-currency enabled, sync the rates directly from Salesforce with one click. All pipeline views, reports, and dashboards display in your base currency with automatic conversion.
Dashboards
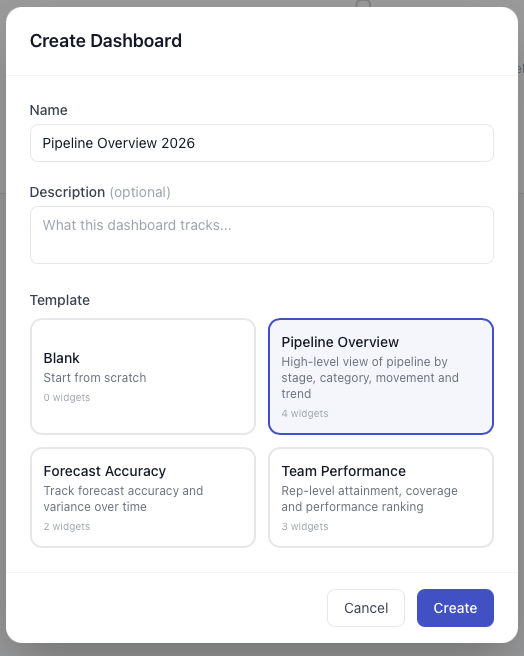
Build custom dashboards from 11 widget types: bar charts, donut charts, waterfall, trend lines, deal tables, metric cards, and more. Arrange them in a responsive 4-column CSS grid. Resize any widget. Click a chart segment to drill down into the underlying deals.
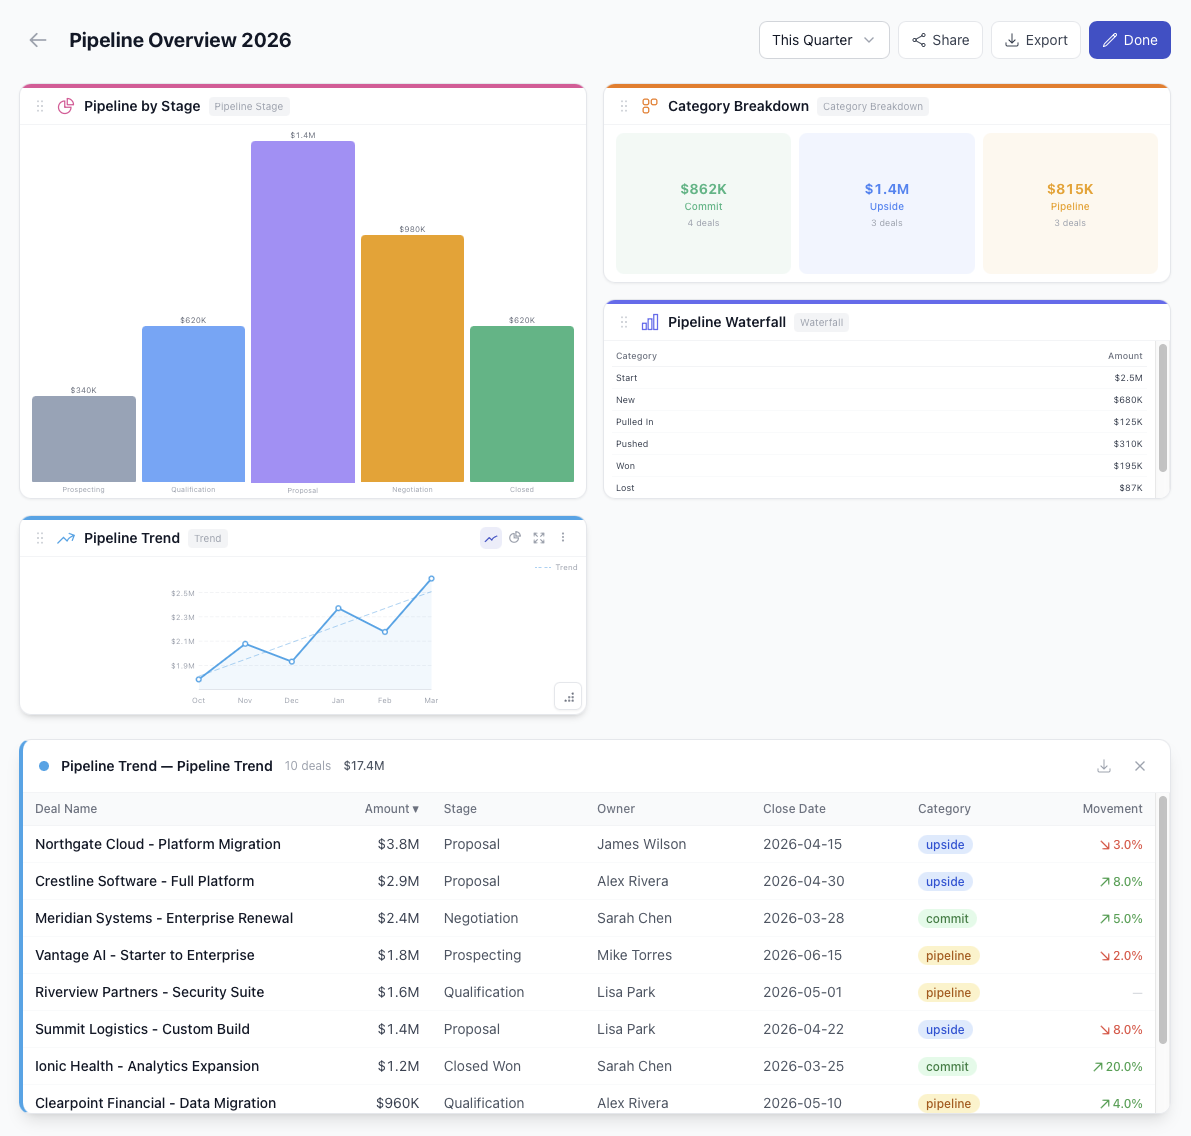
Three templates get you started fast. Pipeline Overview gives you stage breakdown, category donut, waterfall, and trend chart in one view. Forecast Accuracy tracks submissions against actuals over time. Team Performance shows rep-level attainment and ranking. Customise any template or start from a blank canvas.
Snapshots
Every report, every trend chart, every accuracy metric in Pocavi is built from real pipeline snapshots. Not estimates, not sampling, not "last time we checked". Actual point-in-time captures of your full pipeline.
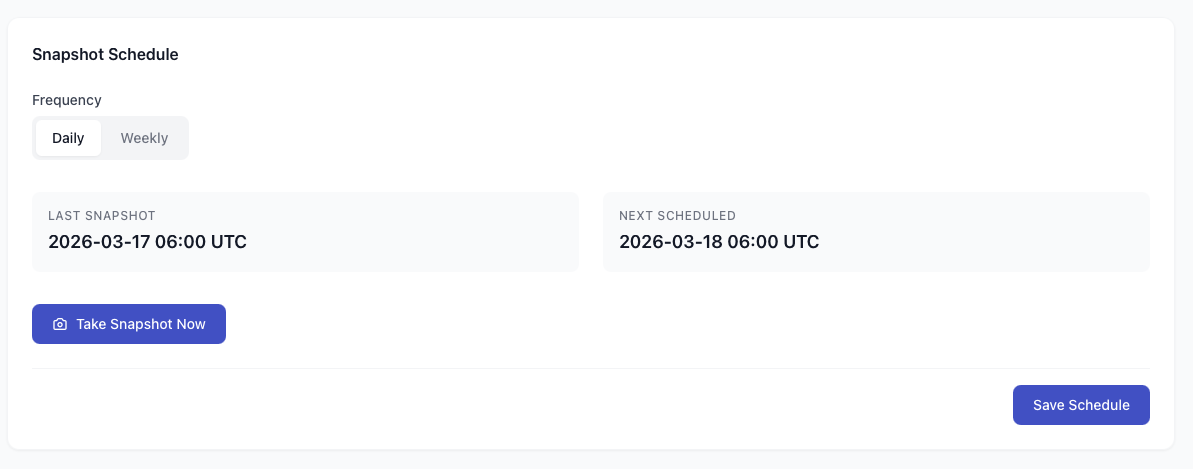
Set the snapshot schedule to daily or weekly. Pocavi runs the snapshot at 06:00 UTC (or your configured time), captures every open opportunity that matches your filters, and stores it. Need an ad-hoc snapshot before a board meeting? Hit the "Take Snapshot Now" button. The last and next snapshot dates are always visible so you know exactly what data you are working with.
Pricing that makes sense
The forecasting add-on is $399/month with 10 forecast users included. Additional users are $15/month each. It works on any Pocavi plan from Business upwards. No minimum commitments. No implementation fees. No separate contract.
Compare that to Clari or Gong Forecast at $50-80+ per user per month, often with minimum seat counts and annual contracts. For a team of 25 users, Pocavi forecasting costs $6,564/year. A comparable standalone tool runs $15,000-25,000+. And with Pocavi, the forecasting lives alongside your backups, deployments, org health scans, and GDPR compliance. One platform, one login, one bill.
AI pipeline forecasting with deal scoring, 9 configurable lenses, what-if scenarios, coaching insights, alert rules, SOQL metrics, multi-currency support, snapshot-powered reports, and custom dashboards. $399/month with 10 users included. A fraction of Clari or Gong, inside the platform you already use for Salesforce ops.